DASHBOARD PREVIEW
SEE THE TERMINAL IN ACTION
The crypto analytics terminal that shows what's actually happening in the market.
No hype or noise.
Just the metrics that matter.
Everything you need to analyze and act on crypto markets with institutional precision.
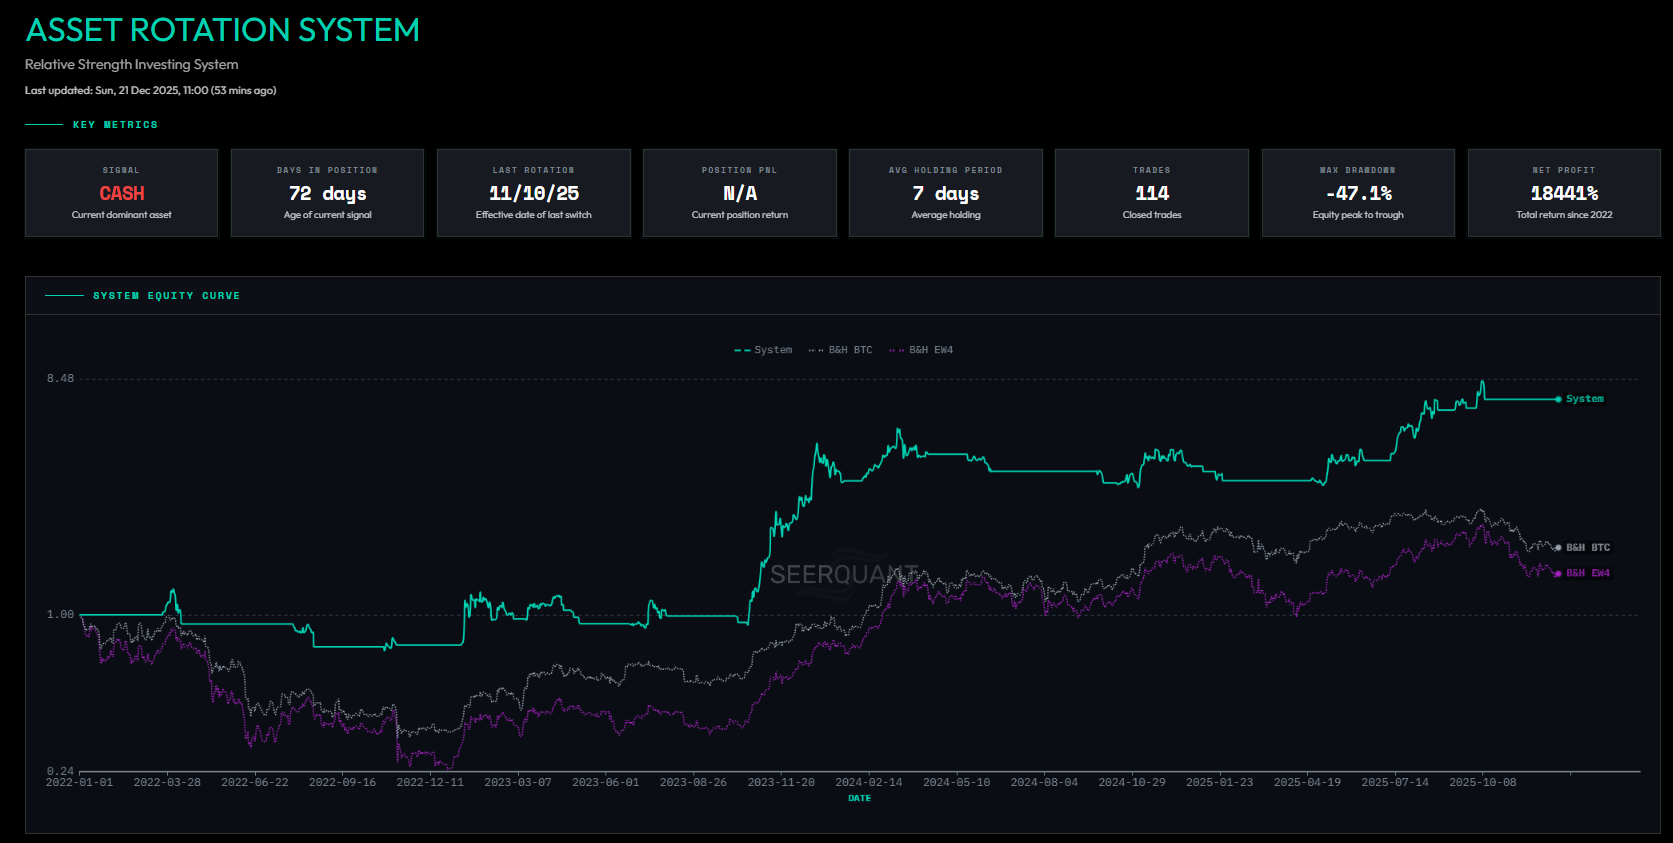
Use our proprietary relative strength framework so you are always holding the strongest assets at the right times.
Find exactly what you need with intelligent search and favorites. No more scrolling through irrelevant charts.
See charts when they matter, not when they don't using our featured charts functionality.
Crypto doesn't exist in a vacuum. Track Fed policy, yields, liquidity, and labor data that move risk assets.
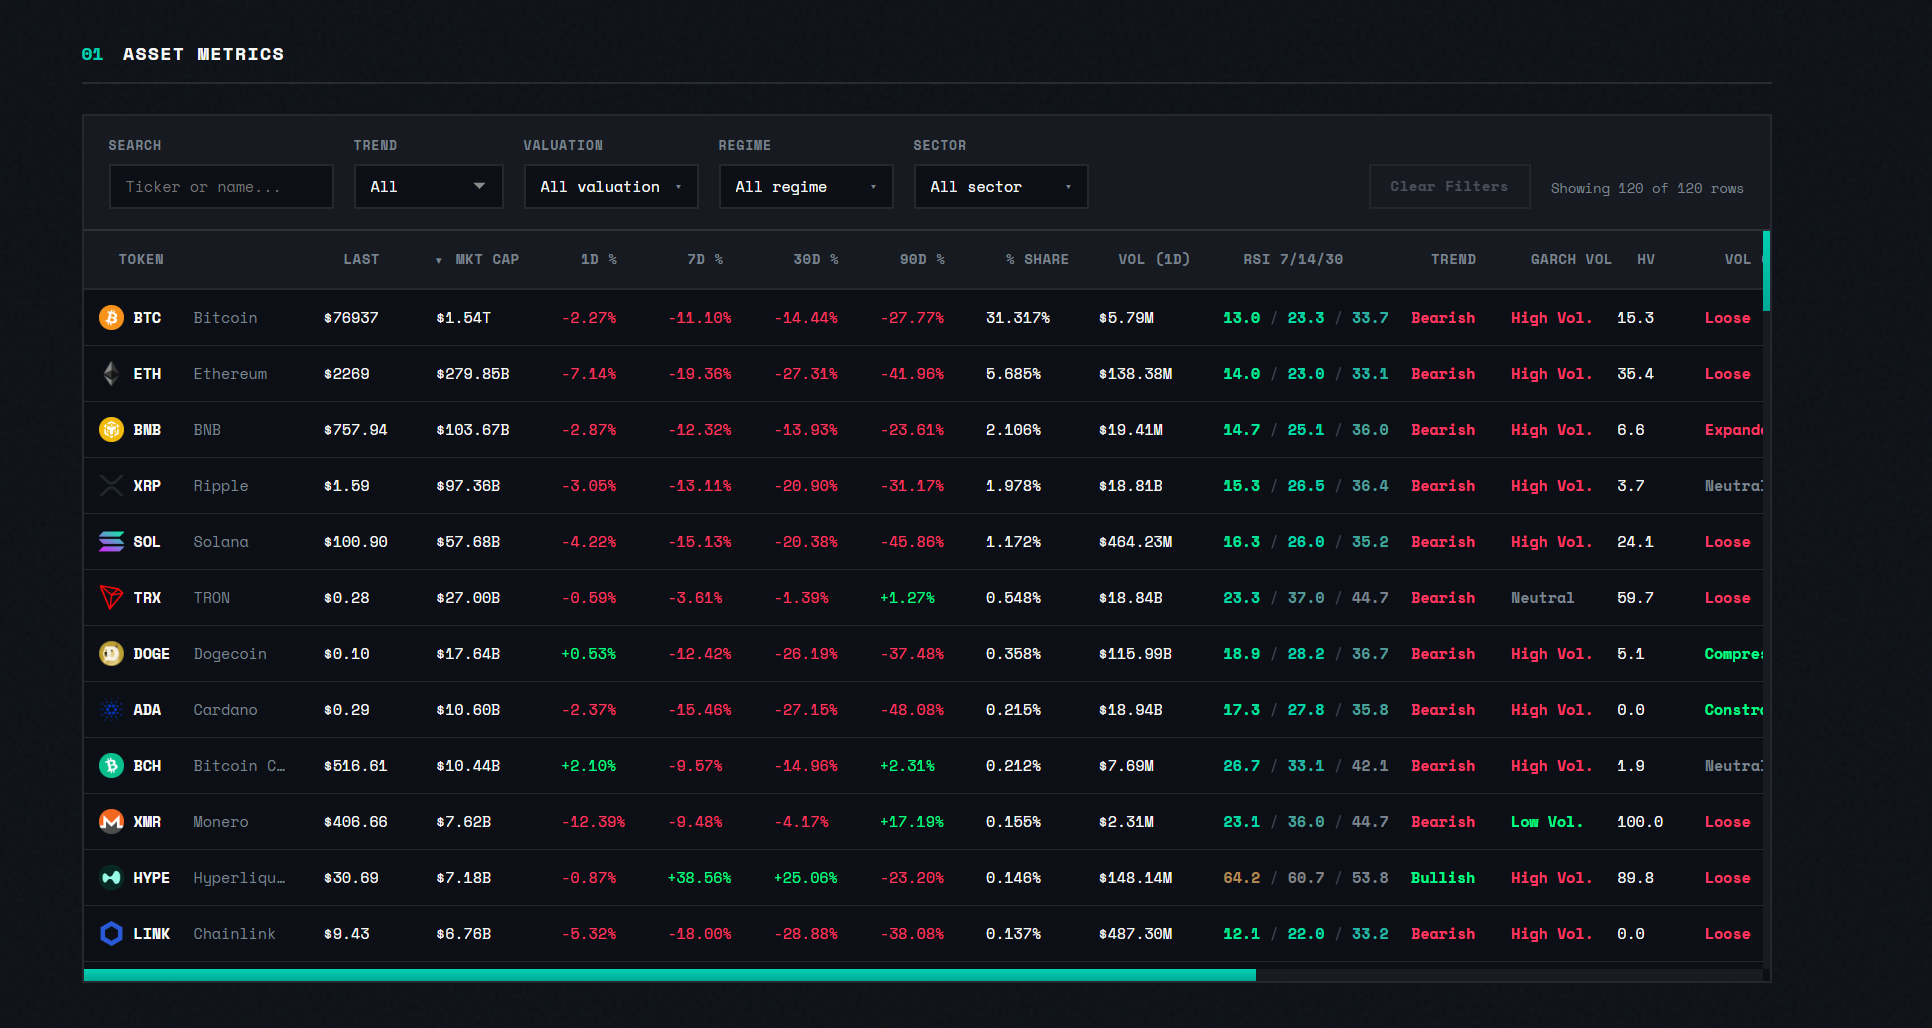
Drill down into any of 100+ assets. Trend, volatility, valuation, drawdown, and momentum metrics for each.
Get notified when metrics hit key levels. RSI extremes, breadth thresholds, regime changes - delivered to your phone.
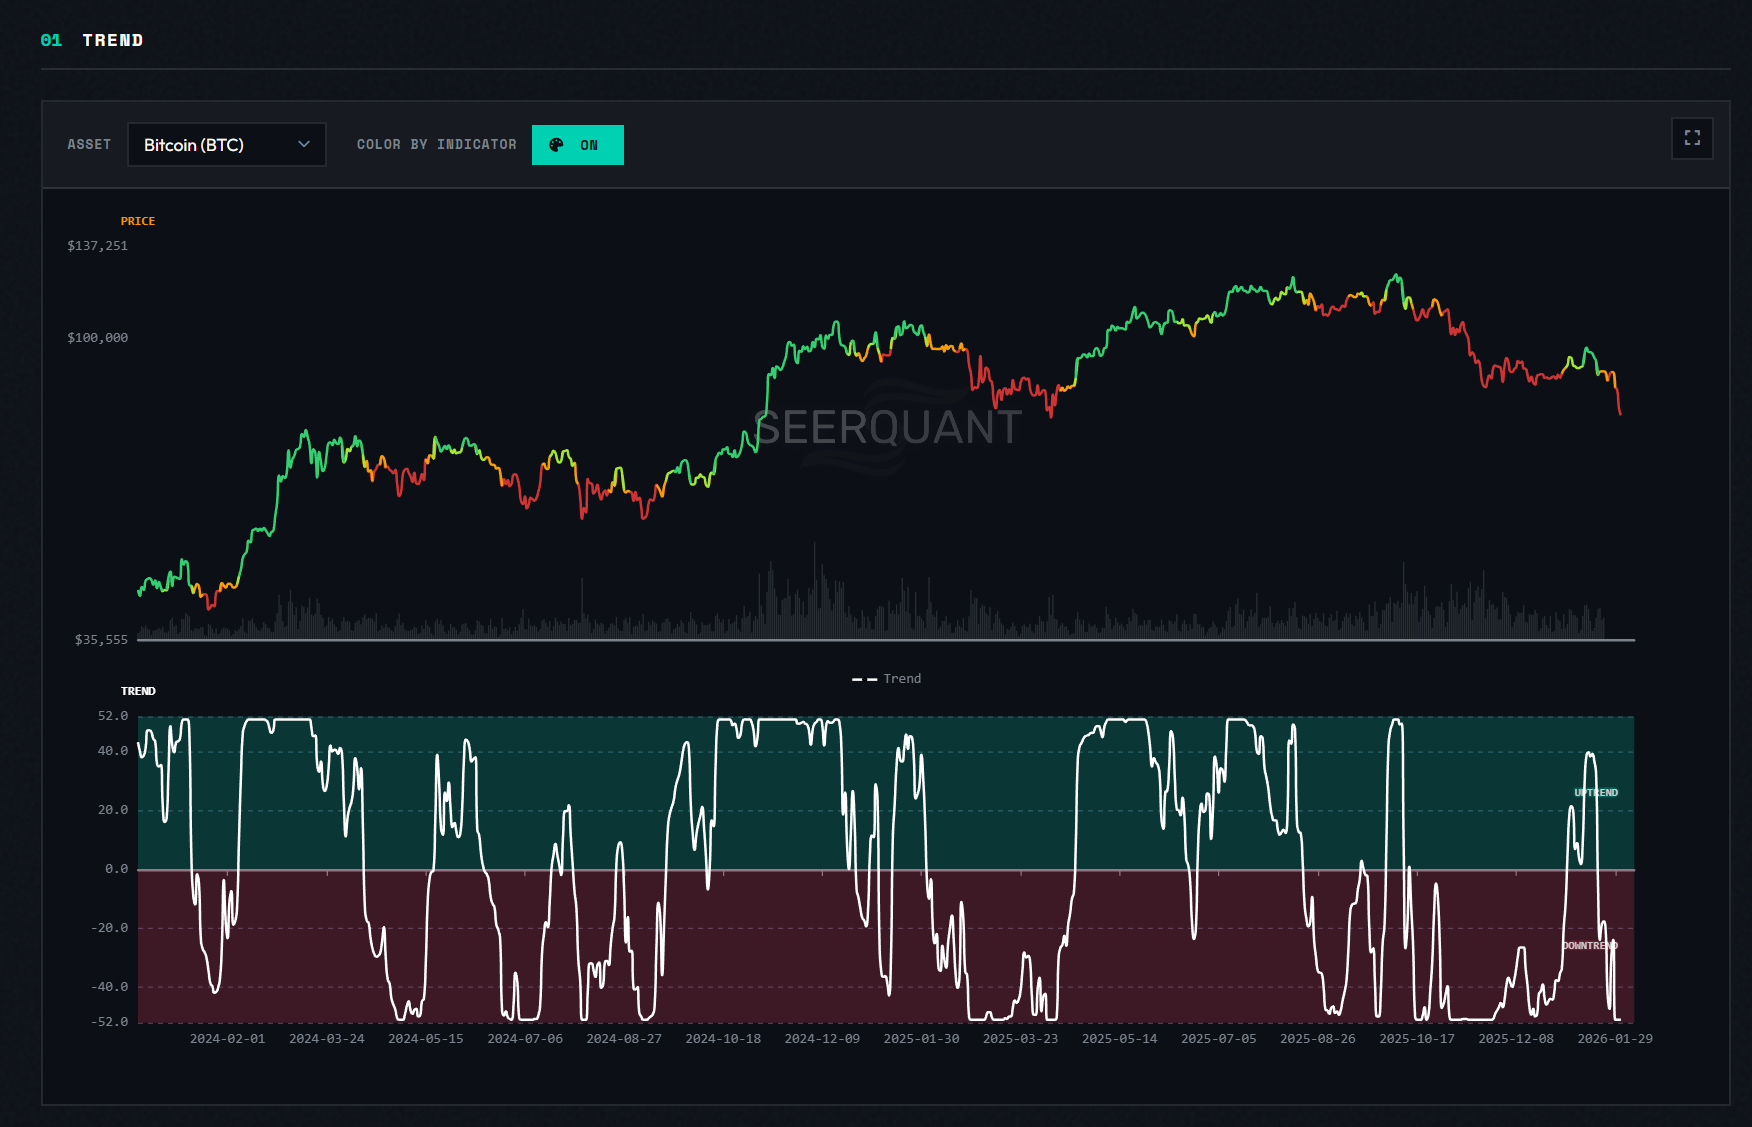
Use our medium term analytics including trend and valuation to find setups with favorable risk/reward.
Time your DCA entries better. Accumulate when valuation is low, reduce when volatility or valuations are high.
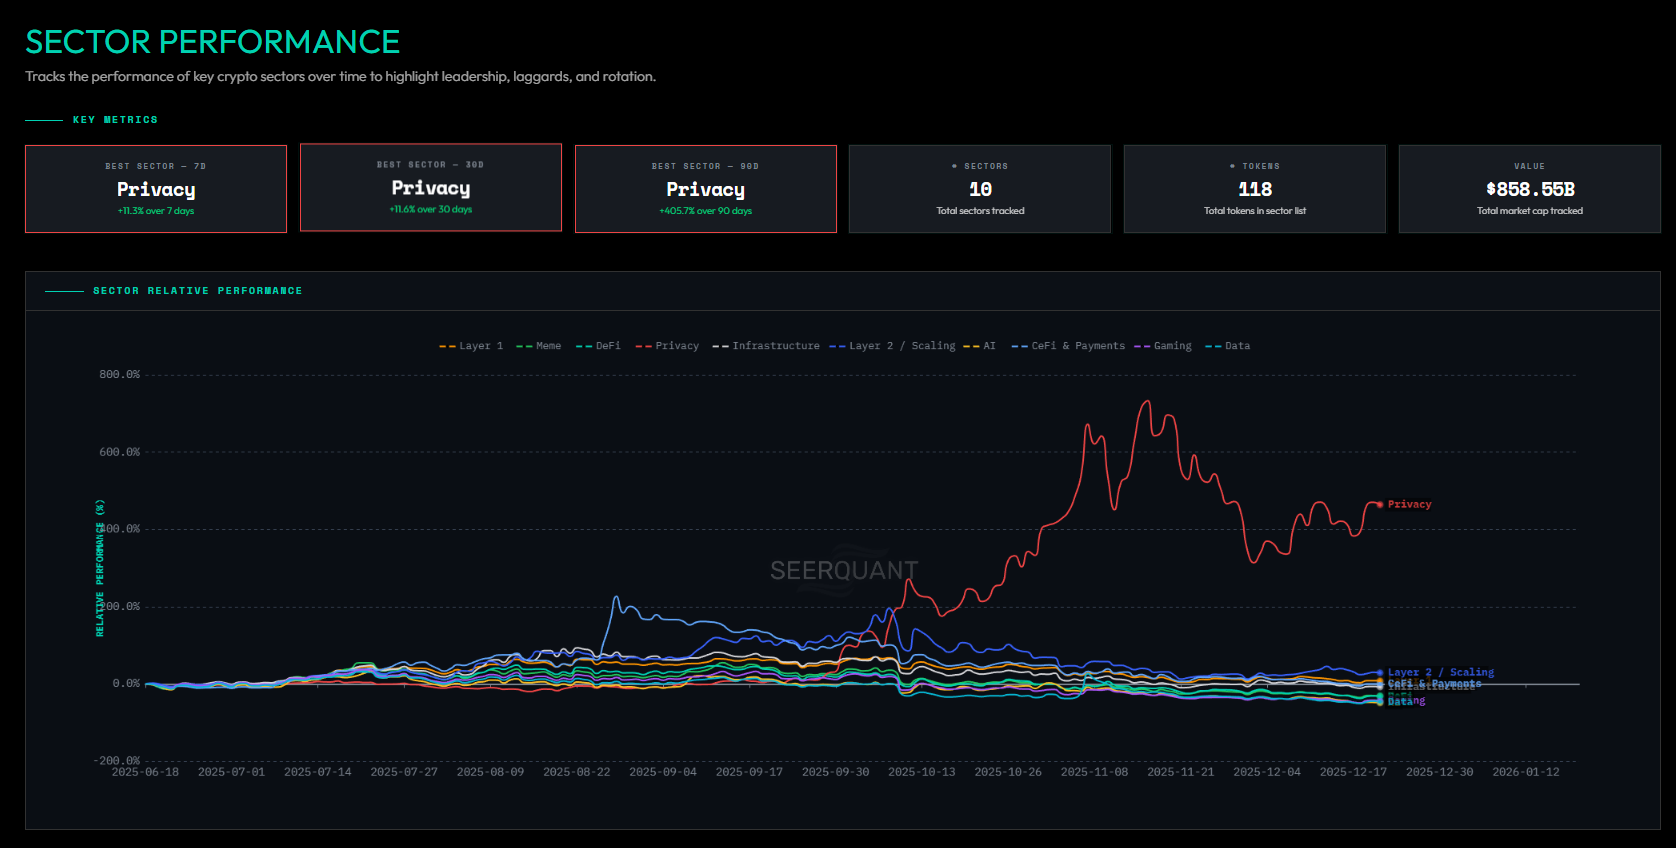
Monitor sector exposure and rebalance based on relative strength. One dashboard for your morning market check.
| Feature | Free Tools | SeerQuant | Bloomberg |
|---|---|---|---|
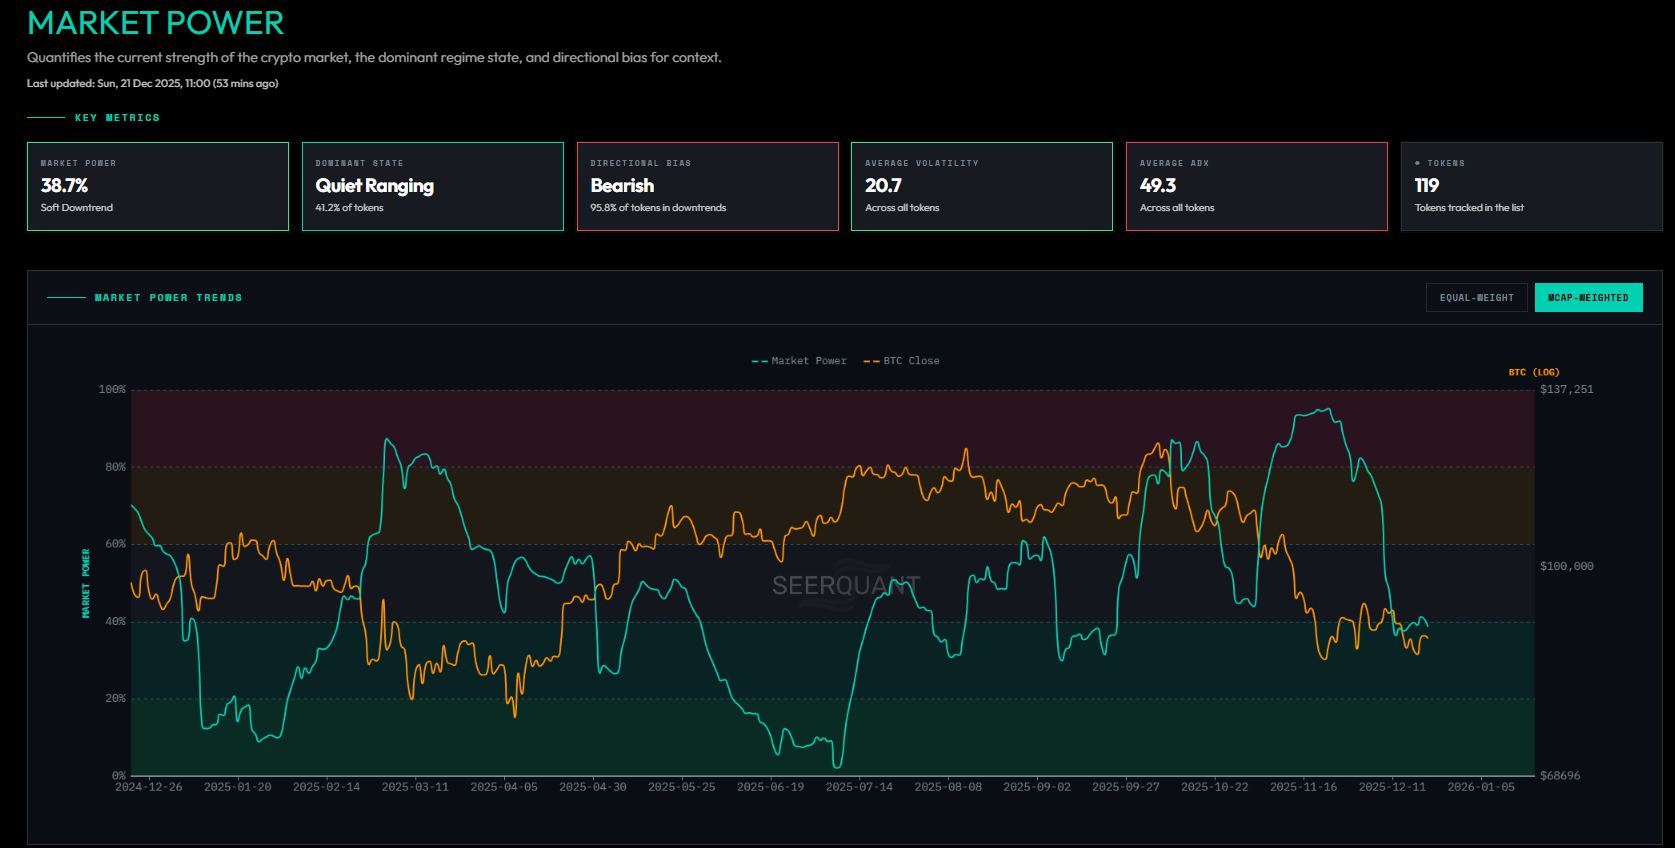
| Market Power Analytics | |||
| Asset Rotation System | Partial | ||
| Sector Rotation Tracking | |||
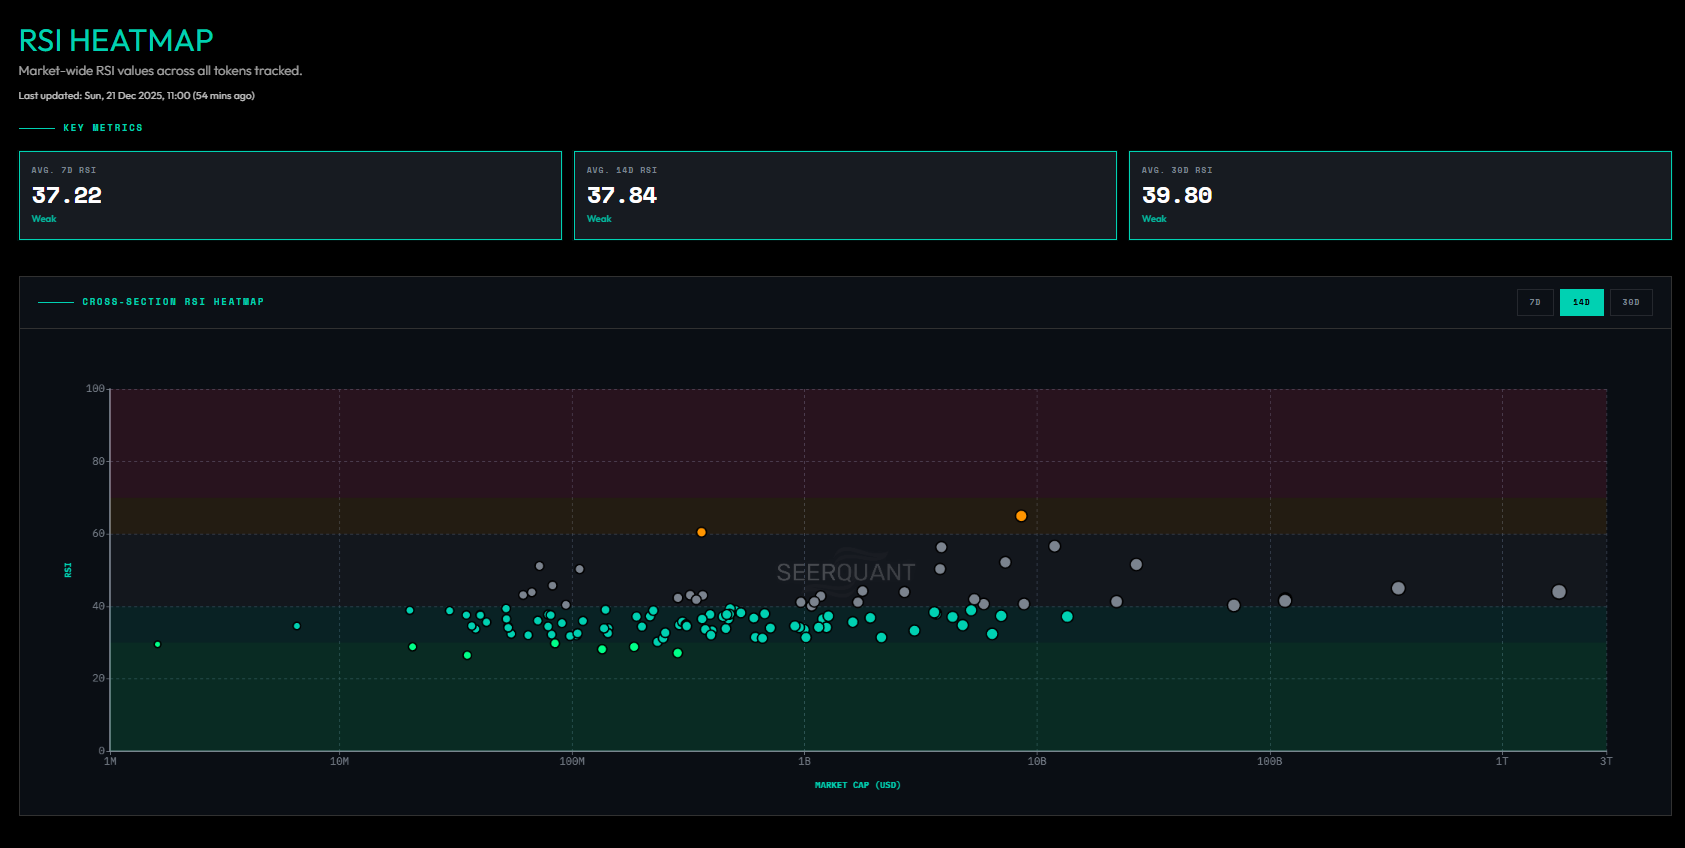
| Volatility & Regime Heatmaps | |||
| Macro Economic Dashboard | Partial | ||
| Intuitive Navigation | |||
| Clean, Modern Interface | Varies | ||
| 100+ Crypto Assets | Partial | ||
| Featured Signals | |||
| Crypto-Focused | |||
| Active Community & Roadmap | |||
| Price | $0 | $25/mo | $2,000+/mo |
No credit card required. Cancel anytime.
Essential metrics to get started. Free forever.
Full terminal access. Professional analytics.
Advanced AI-powered analytics.
CoinGecko shows you prices. TradingView shows you charts. SeerQuant shows you what's actually happening in the market - breadth, rotation, volatility regimes, and macro conditions. We focus on the metrics institutional traders use to understand the market, not just individual asset performance.
Not at all. Every metric includes a plain-English explainer. Our dashboard is designed for traders and investors, not developers. If you can read a chart, you can use our platform.
We track 100+ crypto assets across 12 sectors (L1s, DeFi, AI, Gaming, Memes, etc.) with 24 crypto-specific metrics. Plus 33 macroeconomic indicators covering Fed policy, yields, credit conditions, and labor markets.
Let's be clear: no tool guarantees profits. Markets are inherently unpredictable. What SeerQuant does is give you better information to make decisions. You'll understand market context faster and spot opportunities you might have missed. But the decisions - and the risk - are still yours.
Yes. No contracts, no commitments. Cancel from your Account page with one click. Your access continues until the end of your billing period.
Sign up, get instant Pro access for 7 days. If you like it, subscribe. If not, you automatically drop to the free Starter tier. No surprise charges, ever.
7-day free trial. Join hundreds of traders who actually understand what the market is doing.
WHAT USERS SAY
This alone made me profitable. Kudos mate this is great.
This truly is mind blowing, changed my trading habits completely in a new way. Thank you very much for sharing a masterpiece.
Great! Top one! Shows the real trends!